彩虹的数学

将水滴看作圆球,光线入射到水滴中,经过一次反射,最后再经一次折射离开水滴。光路示意图如下图所示。

通过几何分析计算,可求得入射光偏转角\(\theta_D\)与入射角\(\theta_i\)的关系
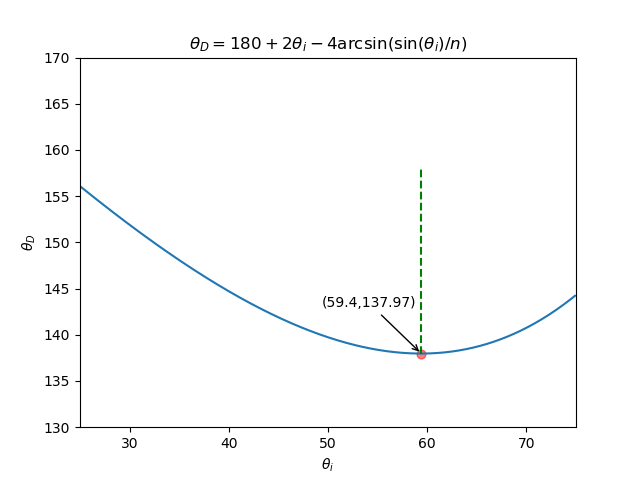
\[\theta_D = 180^{\circ} + 2\theta_i - 4\arcsin(\frac{\sin\theta_i}{n})\]其中,\(n\)为水的折射率,下图中\(n=4/3\).

净偏转角随入射角变化的曲线如上图所示。在入射角\(60^{\circ}\)附近,净偏转角最小,且净偏转角随入射角变化率几乎为0,大量不同入射角的光线最后具有几乎相同的出射方向。这就意味着,在这一出射方向,存在光线的密集效应。这就是我们看到彩虹所在的方向。
Python 3 code
import numpy as np
import matplotlib.pyplot as plt

import os

theta_i_list = np.arange(25,75,0.1)
#
def calc_theta_D(theta_i):
    n = 4/3
    theta_r = np.rad2deg(np.arcsin(np.sin(np.deg2rad(theta_i))/n))
    theta_D = 180 + 2*theta_i - 4*theta_r
    return theta_D
#
theta_D_list = calc_theta_D(theta_i_list)
min_theta_D_idx = np.where(theta_D_list == np.min(theta_D_list))[0][0]
min_theta_D = theta_D_list[min_theta_D_idx]
min_theta_i = theta_i_list[min_theta_D_idx]
fig = plt.figure()
plt.plot(theta_i_list, theta_D_list)
plt.xlabel(r'$\theta_i$')
plt.ylabel(r'$\theta_D$')
plt.axis([25, 75, 130, 170])
plt.plot([min_theta_i,min_theta_i],[min_theta_D, min_theta_D+20],'g--')
str_note = '('+str(np.round(min_theta_i,2))+','+str(np.round(min_theta_D,2))+')'
#plt.text(min_theta_i,min_theta_D-2, str_note)
plt.scatter(min_theta_i,min_theta_D, s=40, c='r', alpha=0.5, marker='o')
plt.annotate(str_note,(min_theta_i,min_theta_D),
             xycoords='data',
             xytext=(min_theta_i-10,min_theta_D+5),
              arrowprops = dict(arrowstyle = '->'))
str_func = r"$\theta_D = 180 + 2\theta_i - 4\arcsin(\sin(\theta_i)/n)$"
#plt.text(40,165,str_func);
plt.title(str_func)
plt.show()
#save figure
path = os.getcwd()+'\\figure'
path = path.strip()
if not os.path.exists(path):
    os.makedirs(path)
#
figname = 'rainbow'
fig.savefig(".\\figure\\"+figname+".eps")
fig.savefig(".\\figure\\"+figname+".pdf")
fig.savefig(".\\figure\\"+figname+".png")